Agricultural Multisensor Drone Camera System Applications
Agricultural Multisensor Drone Camera System Applications
Become a customer to access all support documents.
This image set was captured using an MSDC system equipped with MSC2-RGBN-1-A drone camera. The camera was equipped with a 12 mm standard lens with an aperture of f/4.5. Images were collected flying the drone in a grid pattern at an altitude of 158 m (above the sea level) resulting in a field of view of 38 m x 38 m per frame and a ground pixel size of 8.3 cm x 8.3 cm.
Data set consisted of 156 images (512 x 512 px) of each band (RGB-NIR). All image pre-processing and image geotagging was performed using Spectral Devices multispectral batch processing software msInspector. Radiometric calibration was not performed.
The Open Drone Maps software WebODM was used to reconstruct multispectral orthomap. As an output GeoTiff file of the orthomosaic map is provided containing all the spectral bands. For visualization and manipulation of each spectral band the QGIS software was used. Several standard metrics were applied to the available image bands:
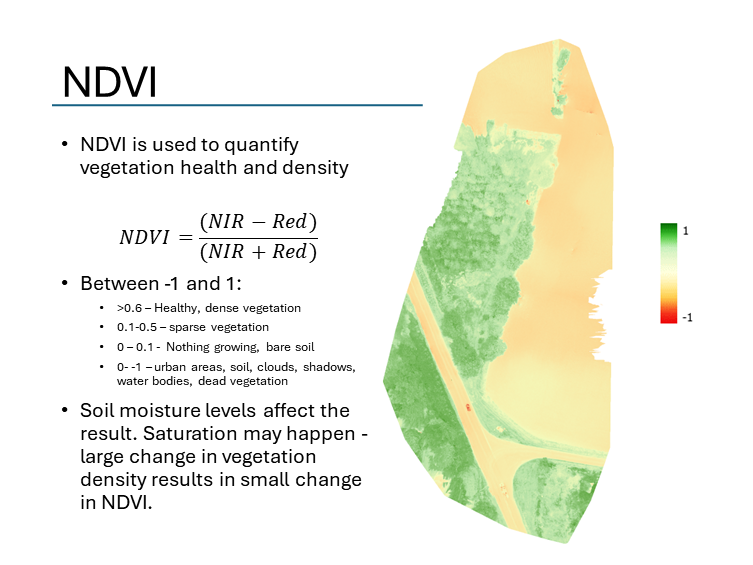
- The NDVI image highlights areas with high levels of chlorophyll in vegetation as green (>0.6), while areas lacking chlorophyll are depicted in yellow and red (0 - -1).
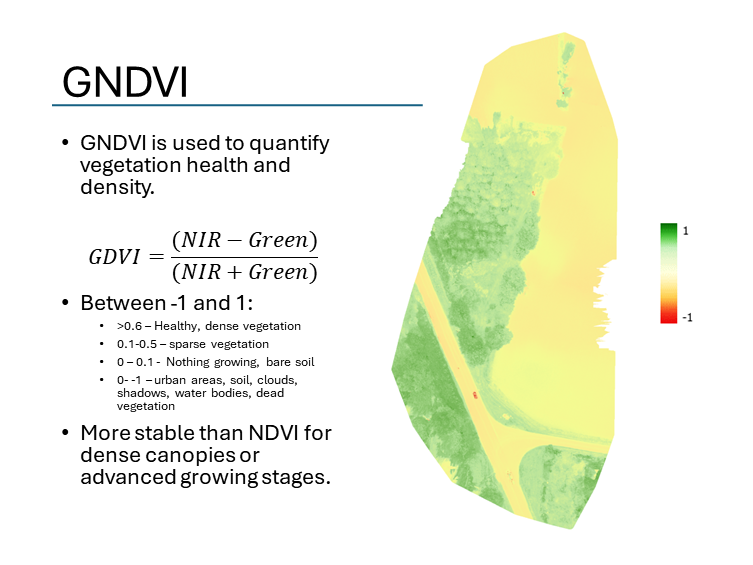
- The GNDVI is similar to NDVI and is known to perform better in presence of more dense vegetation. By comparing the NDVI and GNDVI maps it can be seen that the dynamic range of denser areas has increased.
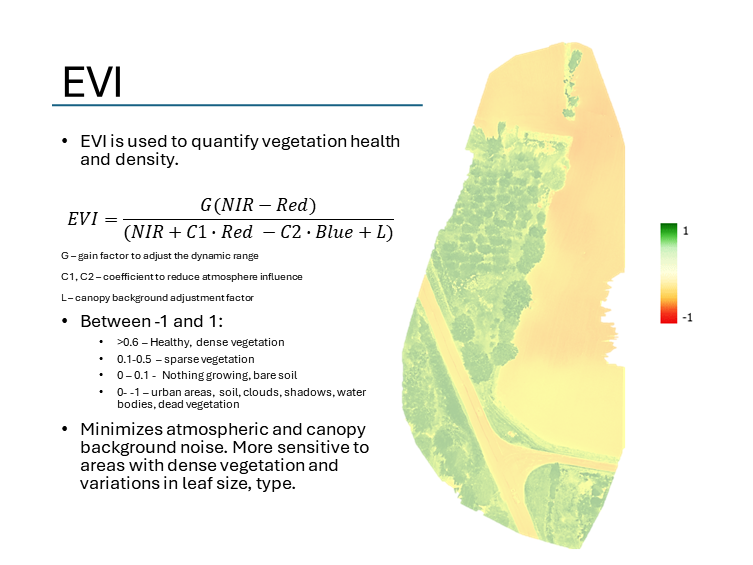
- EVI attempts to compensate for the atmospheric effects and canopy background compared to the NDVI and GNDVI. When looking at the map more distinct tree outlines can be seen compared to NDVI and GNDVI.
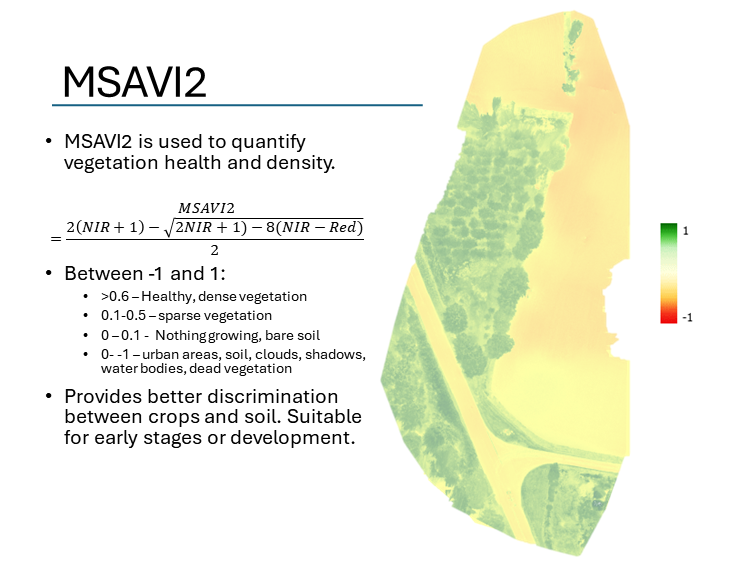
- MSAVI is designed for early vegetation development stages by better discrimination between green areas and soil. When compared to NDVI and GNDVI areas of soil between the trees can be much better visualized, much like in EVI.
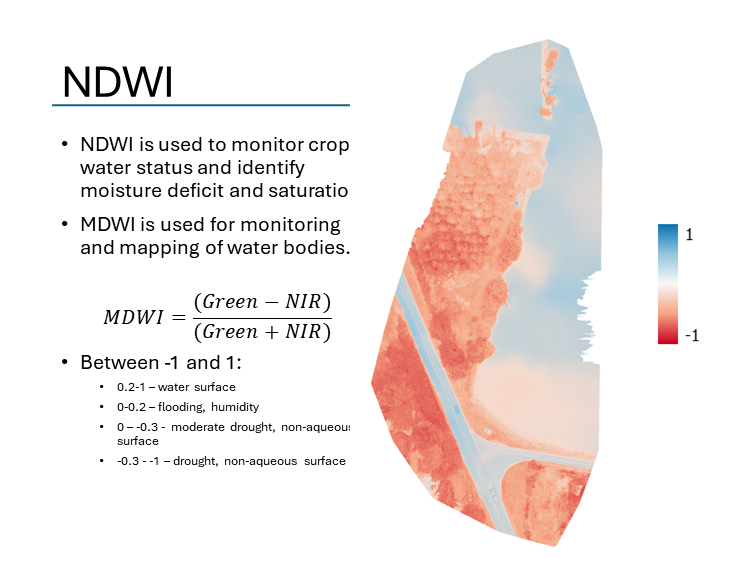
- NDWI is used to monitor crop water status and for body of water mapping. The positive values indicate moisture and presence of water, while the negative values lack water and drought.